April 28, 2026
Maria Fernanda de Julio

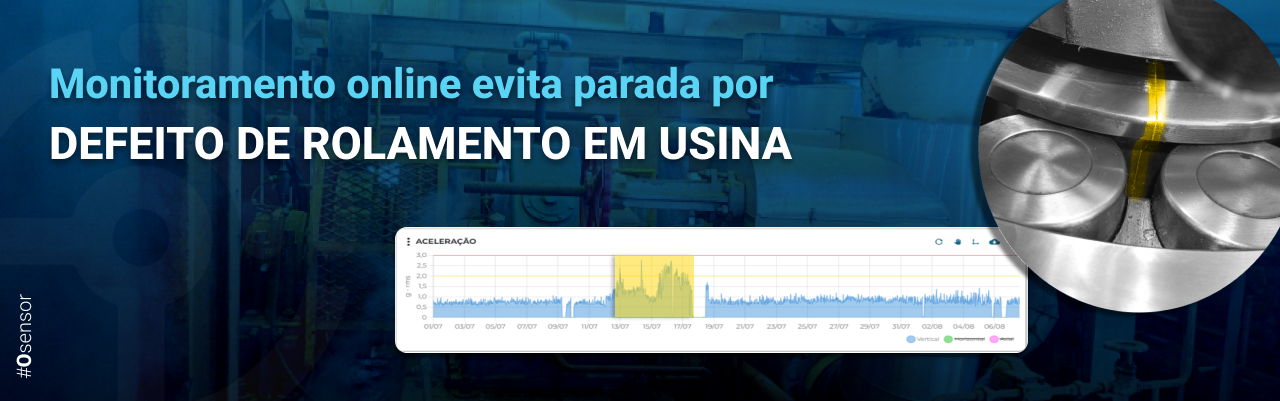
It is the quantitative data collected within a factory that enables the analysis, verification, and diagnosis of the performance of a specific process, asset, or sector. Most of this data is captured by smart sensors such as the Tebe NXG , and then monitored via the IoTebe platform . The indicator is not a target, but rather a metric. It is essential for maintenance planning, as it identifies which equipment is in critical condition and enables the design of measures to resolve imminent problems. Facts speak for themselves.
Imagine driving a car without a speedometer or a fuel gauge—managing industrial maintenance without taking key performance indicators into account is just as dangerous. Data is a maintenance manager’s greatest ally, which is why it’s essential to know what the key indicators are, how to track them, and how to optimize them. Check it out:
MTTR corresponds to the Mean Time to Repair (corrective action) for a piece of equipment that has failed. This indicator is closely linked to maintainability, a metric that reflects the level of difficulty encountered by the maintenance team in restoring equipment to operation after a failure. Mathematically, MTTR is equal to the sum of the Repair Times (Total Corrective Maintenance Time) divided by the Total Number of Corrective Maintenance Actions during a given period of time.
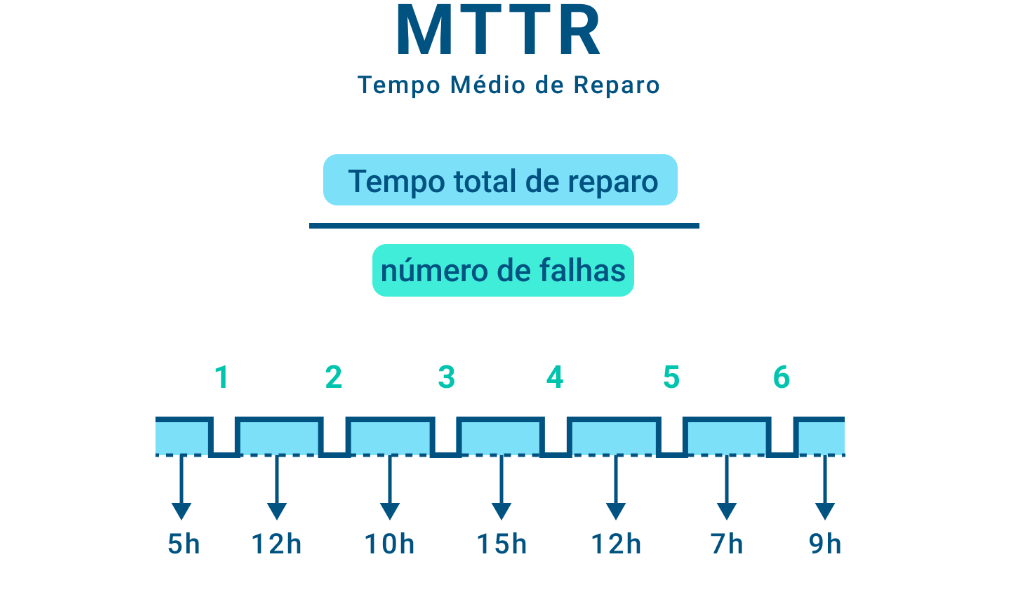
With this in mind, we must strive to achieve low MTTR levels, as this indicates efficiency in repair processes. In other words, the fewer hours required for corrective action, the lower the MTTR will be, and consequently, the shorter the period during which the equipment will be out of service. For single machines that perform a specific function, MTTR is an even more critical indicator, since industrial production depends on the operation of that particular machine, which must resume operation as quickly as possible.
MTTR also allows you to calculate lost profits—the amount of revenue the company loses when equipment breaks down. If we assume that a particular machine generates R$5,000 per hour, for example, the company’s loss from a 12-hour shutdown would be approximately R$60,000 (5,000 × 12).
MTBF stands for Mean Time Between Failures, that is, the period during which repairable equipment operated without breakdowns or failures. This indicator is closely related to reliability, as it reflects the average duration of the machine’s trouble-free operation.
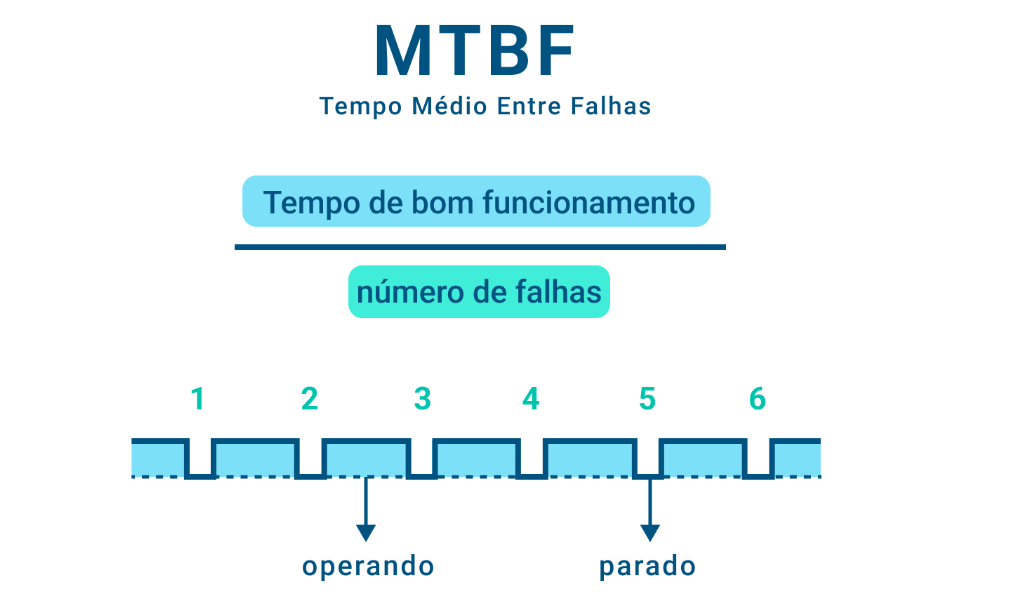
The most effective way to manage MTBF is to apply it to each piece of equipment, as this allows for tailored actions to be taken, taking into account the different lifecycles of each machine. For this metric, we aim for higher values, which indicate a longer period of time during which the machine remains operational.
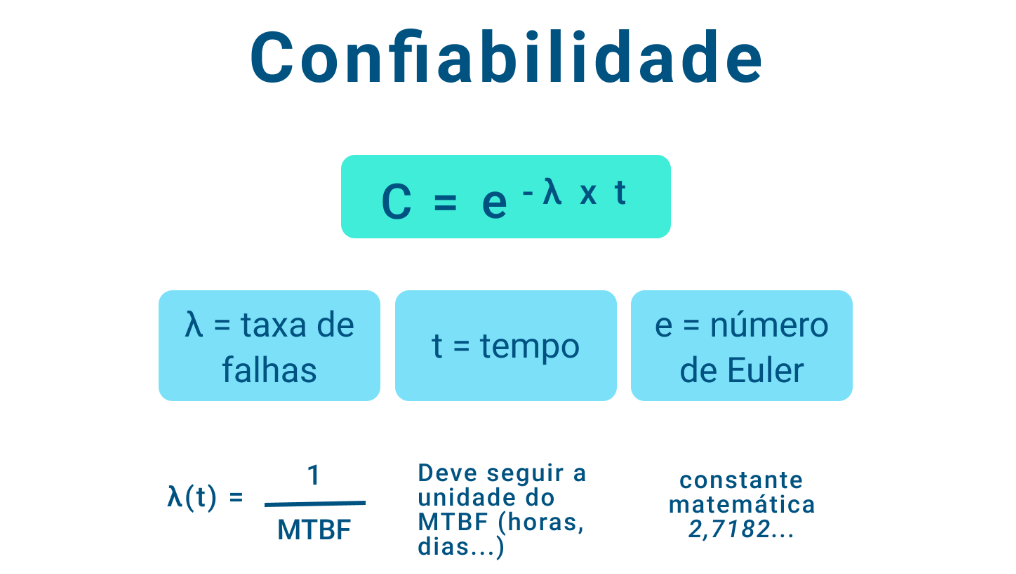
Reliability is defined by NBR-5462 of November 1994 as the “ability of an item to perform a required function under specified conditions over a given period of time.” In other words, reliability measures the proper performance of equipment over the period of time established in the calculation.
The question we should ask is, for example, “What is the probability that the factory’s main electric motor will not break down in the next 100 days?” To answer this question, we must first calculate the MTTR as shown above and use those values in the following formula:
To better illustrate the relationship between these factors, we created a three-axis chart showing MTBF, number of days, and reliability.
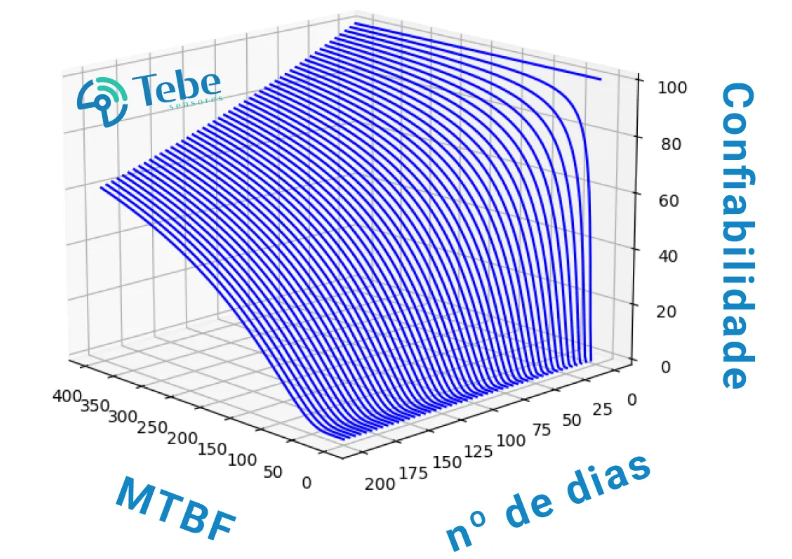
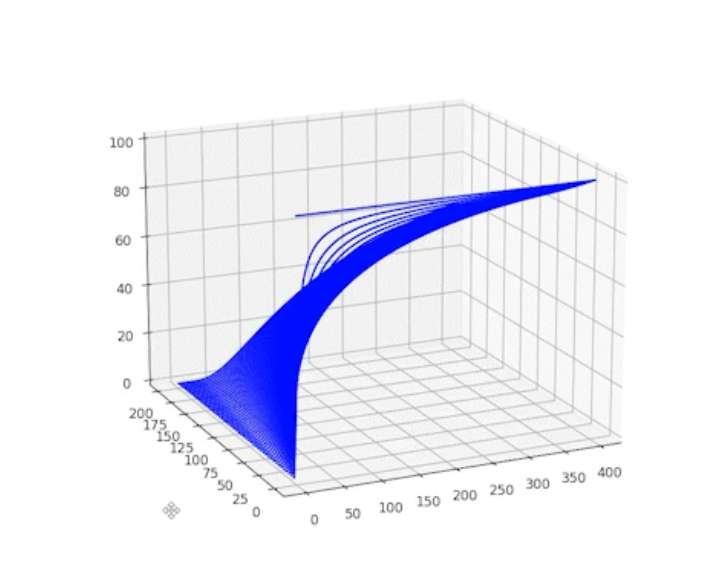
Note that the higher the number of days, the lower the reliability, given the natural wear and tear of the equipment. Conversely, the higher the MTBF, the higher the reliability, since a longer period without failures indicates a more reliable machine. Finally, the higher the number of days, the lower the MTBF, as equipment tends to experience more failures over time.
OEE stands for Overall Equipment Effectiveness and is based on system availability, performance, and quality. In general, it assesses whether the system is operational when needed, its output, and the number of units produced correctly.
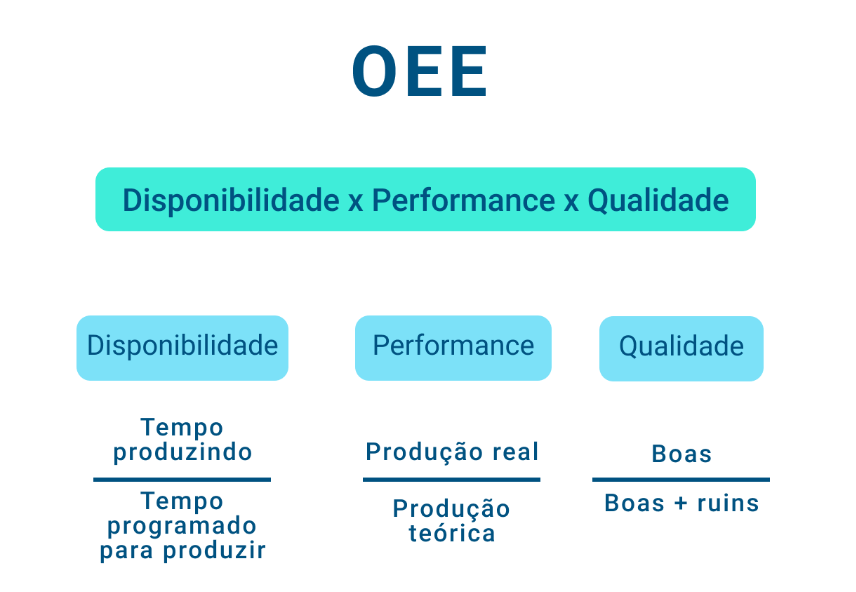
OEE tells us how much time the equipment spent producing relative to the total available time. It also indicates how quickly it produced items during that time, and of the items produced, how many met specifications. As a result, OEE not only reveals the extent of losses but also pinpoints where those losses occur, making life easier for maintenance managers and everyone else who needs to take action to meet production targets.
The CMF highlights the impact of maintenance on the company’s performance, as it makes it possible to determine whether the maintenance department is managing its resources effectively.
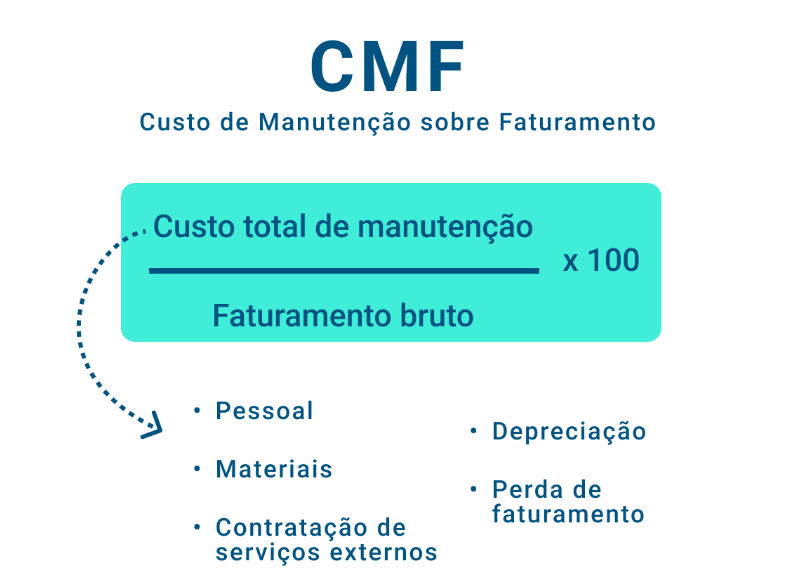
The total cost of expenses directly affects product pricing; thus, if a company spends too much on maintenance, the product becomes more expensive and less competitive. In general, the goal is to achieve lower CMF levels.
For example, let’s say a certain textile company spent a total of R$1 million on maintenance last year. During the same period, the company’s gross revenue was R$25 million. Therefore, the CMF was 4%. But now: is that good or bad?
After calculating the CMF, it must be compared with the industry average for the sector in which the company operates. In this case, the average CMF for the textile industry is 1%, meaning that the company in question spent four times more than the industry average. However, the same company is in line with the average for Brazilian companies in general, since, according to ABRAMAN, on average 4% of companies’ revenue in Brazil is spent on maintenance.
The Estimated Replacement Value represents the amount of capital that will need to be invested to purchase new equipment. In other words, this indicator is equivalent to the maintenance cost associated with the asset.
Think about your cell phone: imagine it broke and you took it in for repairs. When you arrived at the repair shop, you found out that the repair would cost R$100.00. A new cell phone, on the other hand, would cost R$1,000.00. To determine whether, in the long run, it’s worth repairing the cell phone or buying a new one, you’d need to do a calculation. In the industry, this calculation corresponds to the CPMV.
This metric analyzes the maintenance costs associated with each asset (ERV) and determines whether it would be more cost-effective to continue maintaining it or to purchase a new one. It is recommended that this metric be used for mission-critical equipment.
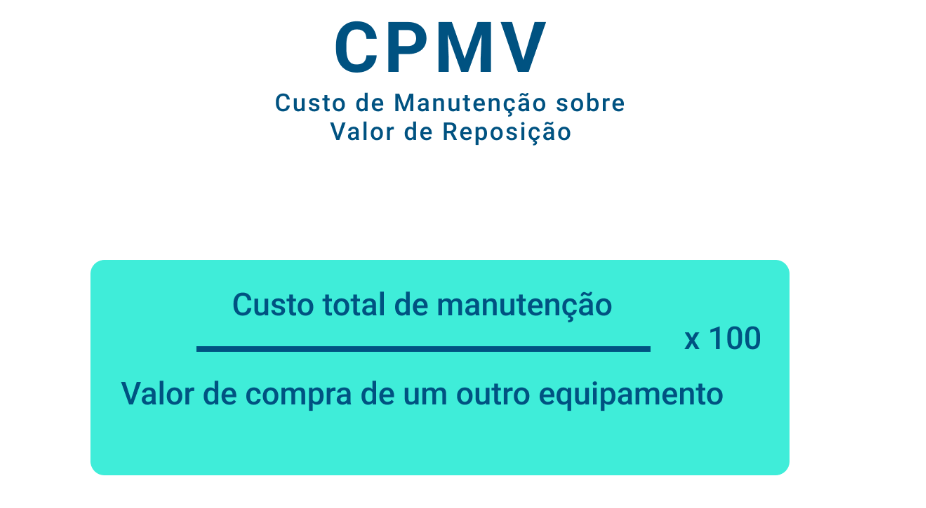
Ideally, this figure should be as low as possible, with the maximum acceptable level being 6% over a one-year period. However, the threshold may depend on the equipment’s condition—in some cases, 2.5% is sufficient. If the calculated figure is higher, it means it is more cost-effective to purchase new equipment than to continue incurring expenses to maintain the old one.
Using the example from the previous point—the broken cell phone—the calculation would be 100/1000 × 100, resulting in 10%. Therefore, if we were to apply the CPMV logic to this case, we would see that it would be more advantageous to buy a new device.
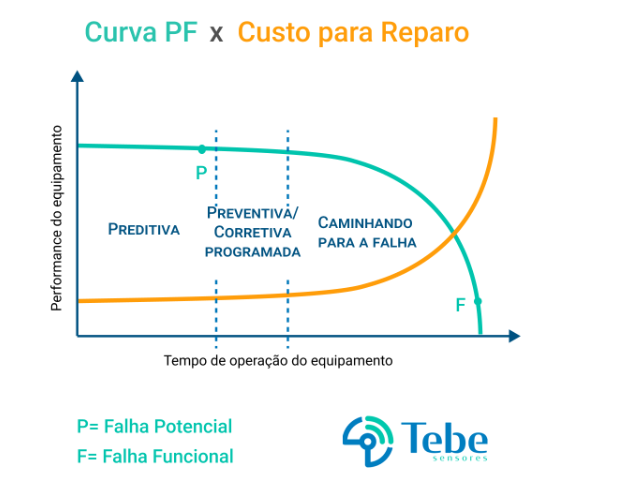
In industry, the most effective way to reduce unnecessary maintenance costs is to minimize the number of corrective actions—where equipment breaks down and is repaired repeatedly. To break out of this vicious cycle, it is necessary to use data analysis to predict failures before they occur. This practice is known as predictive maintenance , which acts at the initial stage of a failure, allowing the cost to repair the asset to be infinitely lower than the cost of getting it back up and running after a breakdown. See:
The term backlog , loosely translated into Portuguese, means “delay.” This can cause some confusion, because not all the tasks in our backlog are necessarily behind schedule. In reality, the backlog refers to the accumulation of pending tasks and the amount of labor time required to complete all current work.
Imagine, for a moment, that no new work orders (WOs) were coming in. How long would the team need to work to complete all the pending WOs that are already scheduled? The backlog calculation is designed to answer that question.
This indicator takes into account maintenance activities (corrective, preventive, and predictive), inspections, improvements, lubrication, installations, etc. In short, the backlog corresponds to the total number of hours for planned, scheduled, completed, and pending services. See below:
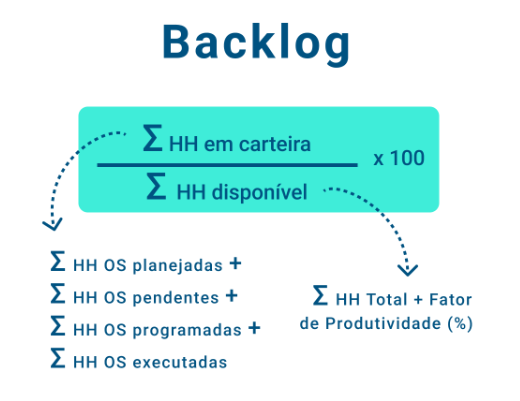
In other words, the backlog shows the relationship between service demand and the capacity to meet that demand. Since it is a time-based metric, it should be calculated in minutes, hours, weeks, months, etc. Ideally, the backlog should be low, as this indicates that service level agreements are being met without overburdening the team.
The abbreviation HH stands for Man-Hour, a unit that measures the amount of work performed by a person in one hour. It is essential to analyze this value according to the type of maintenance to which it is being applied. In other words, this indicator helps us understand how much time is being spent on each maintenance task. If most of the budget is being spent on corrective actions, for example, it is a sign that something is wrong.
Although there are variations depending on the type of facility or equipment, ideally, unplanned corrective maintenance should account for less than 20% of the time dedicated to maintenance; therefore, it is the maintenance manager’s responsibility to keep a close eye on these figures. There is no specific limit for other maintenance practices; in Brazil, preventive maintenance typically ranges between 30% and 40%. In global reliability standards, companies always maintain the predictive maintenance as the largest percentage of the distribution.
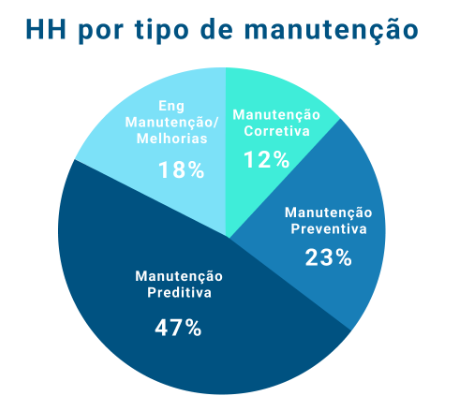
To calculate the percentage of man-hours by maintenance type, you need to determine the total number of man-hours spent on maintenance overall and break it down (by work orders) by activity.
Wrench Time , loosely translated, means “Wrench Time.” In other words, it is the time an employee spends with a wrench (tool) in hand during maintenance work. In other words, it is the Labor Productivity Factor.
This index represents the percentage of time an employee spends performing the tasks for which they were hired, for example:
excluding time “wasted” on activities that do not generate value or results, such as:
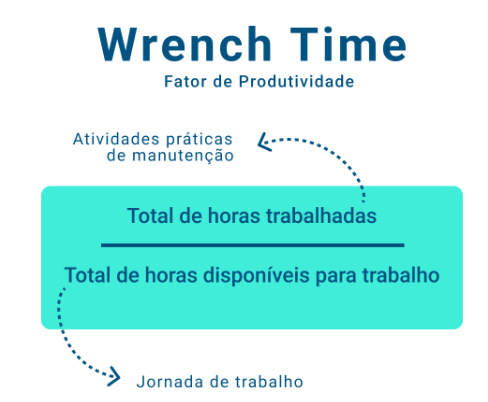
The Productivity Factor is a key metric for maintenance planning, as it measures its effectiveness. Unplanned or poorly planned maintenance can result in approximately 65% of time being wasted. In this scenario, a team of mechanics working an 8-hour and 48-minute shift actually produces results for only about 3 hours.
The Industry 4.0 has enabled significant advances in data collection and analysis, so that management decisions are increasingly based on this information. This data is obtained through smart technologies, which constantly monitor the status of the entire industrial production chain. This makes the information more reliable and provides valuable insights into asset reliability and availability in real time, in addition to helping improve the metrics themselves. Remember: to analyze whether indicators are improving or not, you need a history of equipment operations.
It is essential that maintenance managers encourage their teams to use predictive and responsive maintenance techniques to assess the health of machines, in order to diagnose failures at an early stage. This allows for early intervention, which reduces costs and prevents equipment from reaching a critical breakdown point. In practical terms, the improvements provided by Predictive Maintenance 4.0 for each indicator are:
MTTR: More than just keeping MTTR low, constant monitoring of sensors such as the Tebe NXG helps prevent breakdowns, so corrective actions are not necessary;
MTBF (Mean Time Between Failures): since breakdowns and downtime are avoided, the machine’s uptime increases, thereby raising the MTBF;
Reliability: As a result, the equipment becomes more reliable, since the higher the MTBF, the greater the machine’s reliability;
OEE (Overall Equipment Effectiveness): as the machine operates longer, produces more, and performs better, its availability, performance, and quality increase;
CMF (Maintenance Cost as a Percentage of Revenue): by reducing breakdowns, corrective actions are also reduced, which leads to lower maintenance costs. In addition, high productivity contributes to higher revenue, so that the CMF represents a higher percentage;
ERV (Estimated Resale Value): since the machine’s performance is improved and its service life extended, the ERV tends to indicate that maintaining the equipment is more advantageous than replacing it, which saves additional costs associated with purchasing new equipment;
CPMV (Maintenance Cost as a Percentage of Replacement Value): by reducing costs associated with corrective maintenance and the purchase of new equipment, Predictive Maintenance 4.0 significantly lowers the MRC percentage;
Backlog: an increase in the Productivity Factor directly contributes to better execution of work orders, thereby reducing the backlog;
HH by type of maintenance: the more faults are diagnosed at an early stage, the fewer corrective actions are required, which contributes to a sound investment of the maintenance budget;
Wrench Time (Productivity Factor): real-time monitoring with online access on platforms such as IoTebe , streamlines the maintenance process on multiple levels, reducing downtime and increasing workforce productivity.